We’re QAs, we’re supposed to find bugs, right? The more - the better?… Right? Let’s have all the discoveries in the backlogs because someday we may fix that 5-year-old bug, right? … Lina??
Lina has a rant that hopefully is also actionable and useful on bug backlogs and a particular metric that has proved to help - the average bug age.
Table of Contents
- On Bug Backlogs and Why You Should Keep Them Cleaner
- Let’s Talk Metrics: What’s your Bug Age?
- Conclusion: Visualize Your Progress
On Bug Backlogs and Why You Should Keep Them Cleaner
One of my pet peeves is messy bug backlogs. A colleague of mine recently told me that, in their opinion, my strength is organizing things. Must admit, I did briefly consider becoming the Lithuanian Marie Kondo, yet, I do not think everything that does not spark joy should be thrown out, especially in software.
I do not hate JIRA, I actually really love making it cleaner and clearer. It’s a tool, and it’s useful because it helps us visualize and organize our work.
Visualizing and limiting (!) work helps focus better and follow up on tasks without overwhelm.
Getting overwhelmed in bug backlogs of 500+ bugs is a common issue many teams face. It’s time to question this. Especially if you’re a person with a “Q” in their title (Q for Questions, of course).
When you’re in a messy room, it’s terribly hard to find what you’re looking for. The same happens with bug backlogs.
To create some order and not drown in noise, we need to continuously revisit backlogs, get honest with ourselves on what we will fix and won’t, and either tackle by fixing or close issues we do not plan to fix in the foreseeable future (yes, I’m a QA, and, I’d advise to close some bugs).
For the cleanup strategies, I could write another post - I’ve seen teams do various efforts like dedicated time for bug fixing/revisiting/closing (feel free to reach out if you’d like that).
Let’s Talk Metrics: What’s your Bug Age?
Whatever cleanliness state your bug backlogs are, I’m a big fan of dashboards - let’s visualize what we have. That not only helps us to track progress and talk using data but also motivates the teams to actually tackle those bugs.
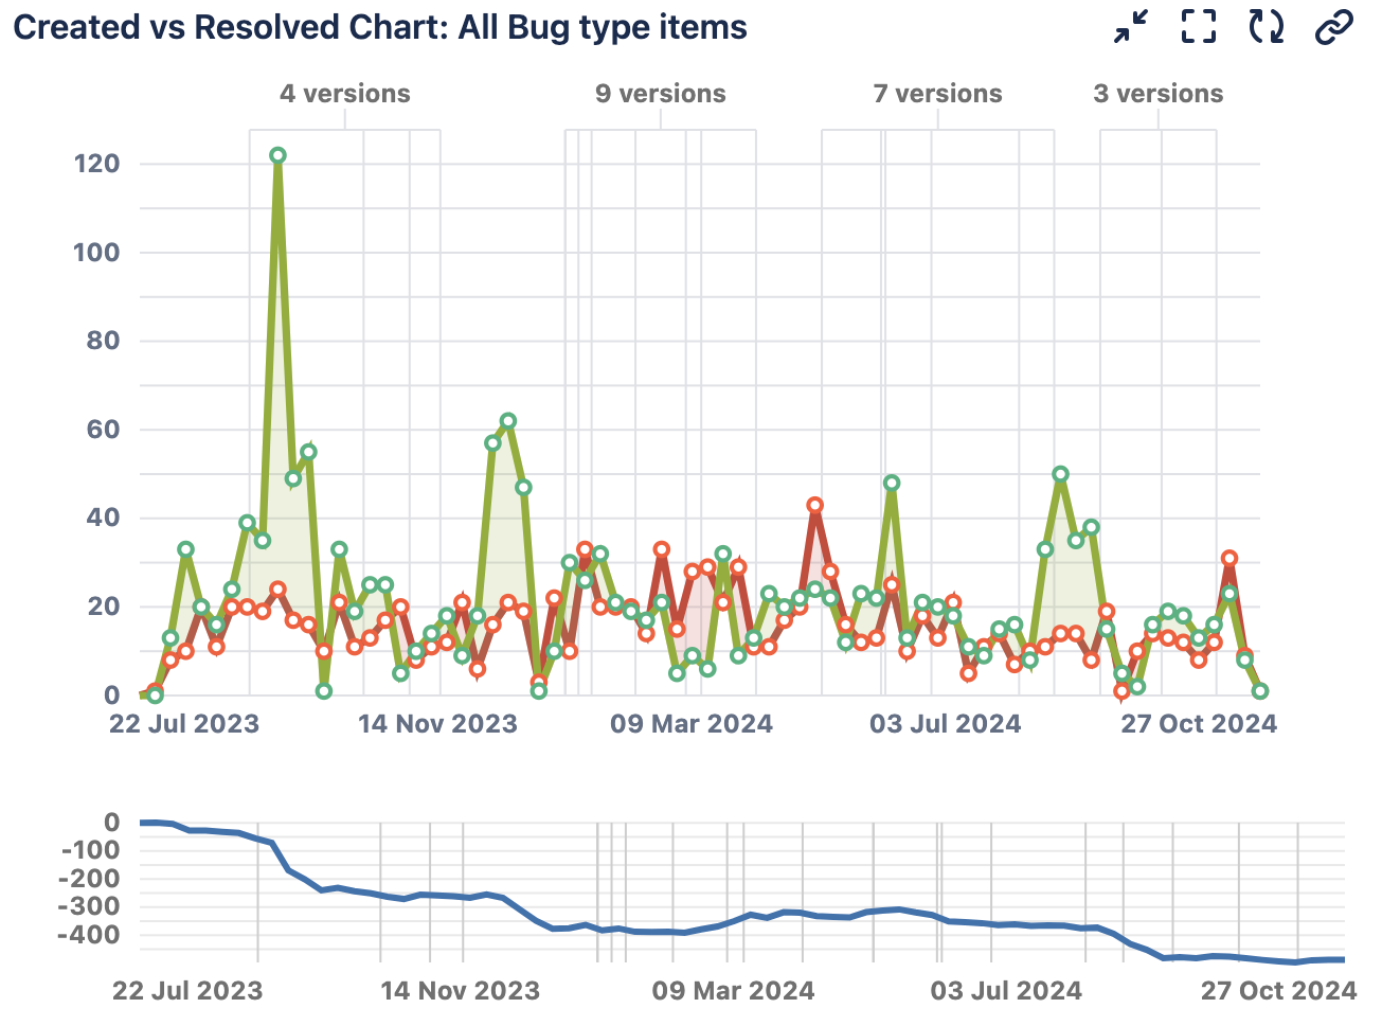
For example, talking about cleanups of backlogs - one of the most rewarding graphs in an open-source project, where JIRA is open and everyday reports are coming in, is resolved vs. created bugs. If you’re in the negative means that you resolve more tasks than get created. For a legacy system that means a huge cleanup is taking place (even if at times it does not feel like that at all).
 Example of a Resolved vs. Created Bugs and Resolution Trend Chart from a JIRA Dashboard
I love my JIRA dashboards on bug progress. I have different dashboards for different use cases and contexts. There’s one for overall project bugs, others split by team with what matters to them, or specific topics/areas of bugs. I include various stats there, and, there’s one metric that indicates the health of the project overall for me: the bug age.
What does the average age metric mean?
You can find this metric in JIRA, and likely any other bug tracking system.
Average age calculates the average amount of days issues were unresolved over a given period of time.
You could use this metric for any work item, but I especially like to use it for bugs. It depicts multiple aspects of the system/company/team:
-
How stale and “old” the backlog is
The staler the backlog, the more there’s noise. Imagine if your average age chart is 700 days (I may or may not be talking from experience). That means that sometimes you may report a bug and not get it fixed for almost 2 years. That’s nuts. Note here that if you do some cleanups you may see a spike, but that’s expected as you closed many old bugs. However, in the long run, you will start seeing a trend of much smaller numbers.
-
How quickly we may expect something to get fixed
As much as we may hate seeing this metric and admitting to ourselves that on average it takes 700 days (as in the above example), it is uncovering a pattern and sets an expectation.
-
How we’re improving
This point is the one why I visualize problems, because I believe we always can get better, and seeing progress is so rewarding. It’s super motivating for the teams to have data to illustrate their efforts.
Improving Quality Culture with Average Age Chart
When I first visualized the average age of bugs - I was shocked. In some cases, it was around… 2 years. Ouch.
I used dashboards to talk about our “bug situation”. I shared them with teams. I added other panels to visualize where sometimes bugs get stuck (“time in status”) or the overall number of bugs. It planted a seed in people’s heads. It made them aware of actual data, and, not just a subjective feeling.
Some teams dedicated time to fixing bugs, some product managers went through backlogs and closed the ones they wouldn’t work on, and other people joined in to recheck backlogs. I poked a lot. I asked around.
First, the average age metric spiked. I calmed down the team: it was normal - we were cleaning up. In the long term, our goal is to fix bugs as soon as we get them reported and have our average age chart as low as it can get.
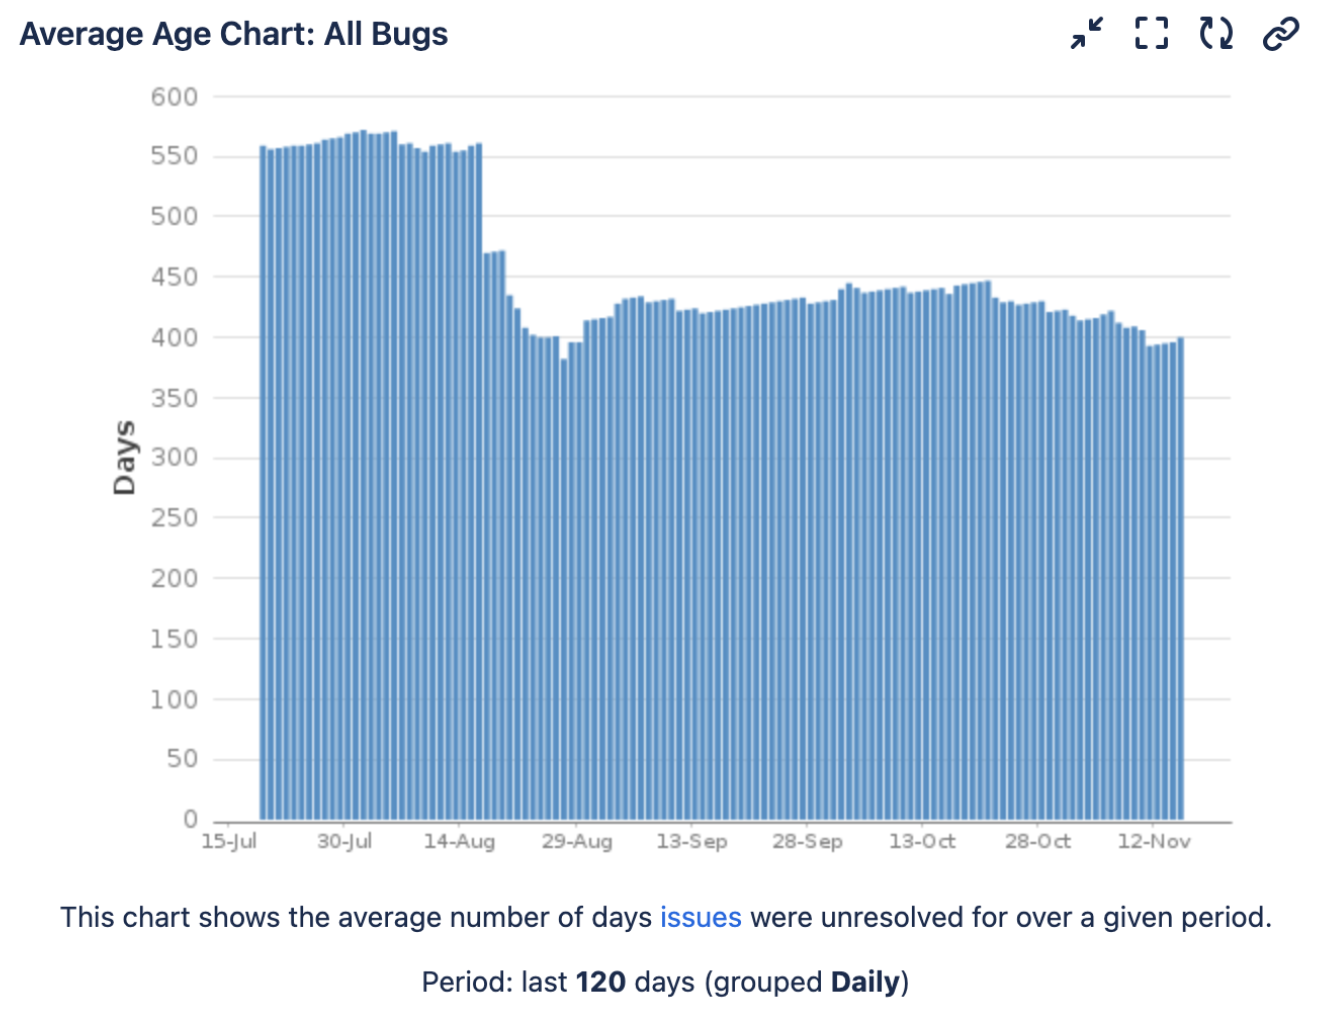
With time and effort, I started seeing graphs like this:

Example Average Bug Age Chart from JIRA
The bug age did drop as this team cleaned up. I wish it looked even better. Yet we still need more time to get to 100 or 10 days age for these bugs… We continue having ups and downs, but there’s a huge improvement. And that’s what I make sure we keep on celebrating.
In addition, a level of competition creeps in when teams start to compare themselves with others. After this team had their graph looking like that, another team got determined to achieve an even better number: “How could we let those boasters have a better number than us???”
In the end, though, as cheesy as it is, the best competition is with yourself. Teams seeing their improvement and striving to be even better is what matters the most. Imagine looking back and seeing that from 2 years bug age now it’s a month - what an achievement. Using metrics like average age, we already resulted in much cleaner backlogs, faster feedback loops, a better understanding of bugs, and raised motivation (and quality) by celebrating where we have improved.
What’s the target bug age?
When I shared the draft of this article with Justas (check out his blog Testwhere), he was not impressed: “Lina, but it’s 400 - it’s still so much!” I went on to tell him more about the cleanup efforts we did, how it’s a huge legacy backlog, and how long the change takes place. Then we brainstormed about the “ideal” state. What’s that?
Well, if we truly clean up, and fix bugs as soon as they reach us - that’s the famous (or infamous) zero bugs policy. Zero bugs policy does not mean that you won’t have any bugs. It just means that you immediately prioritize and fix, or do not fix it and close it.
What would we say then the bug age would be? We could say it’s a week or two on average, right? Some bugs may be bigger, others smaller. So, we’d have 10-20 days.
If your bug age is 10-20 days - you’re doing a pretty great job, I must say. As much as 400 days from 600 days may seem like it’s still enormous, many companies are in a much worse state… Imagine products that have existed for many many years, many of them have old, stale backlogs. The change will come if we get honest with ourselves and actually take on the cleaning, closing, and fixing efforts.
Visualize Your Progress
In the end, if there’s only one thing I want to encourage you to do, it’s this: try visualizing metrics like bug age (and not only), mention them in your quality conversations, and do not forget to celebrate progress.
The best metrics are the ones that do not punish, but motivate to improve.
Lots of metrics could be rigged and played, so remember to add dimensions, use different metrics + context, and treat them responsibly so that they act as a supporting tool that inspires, and sometimes reminds you that you’re doing a great job even if it feels like it’s never improving. It likely is improving. Just not as fast as we’d want. Change can be quite slow.